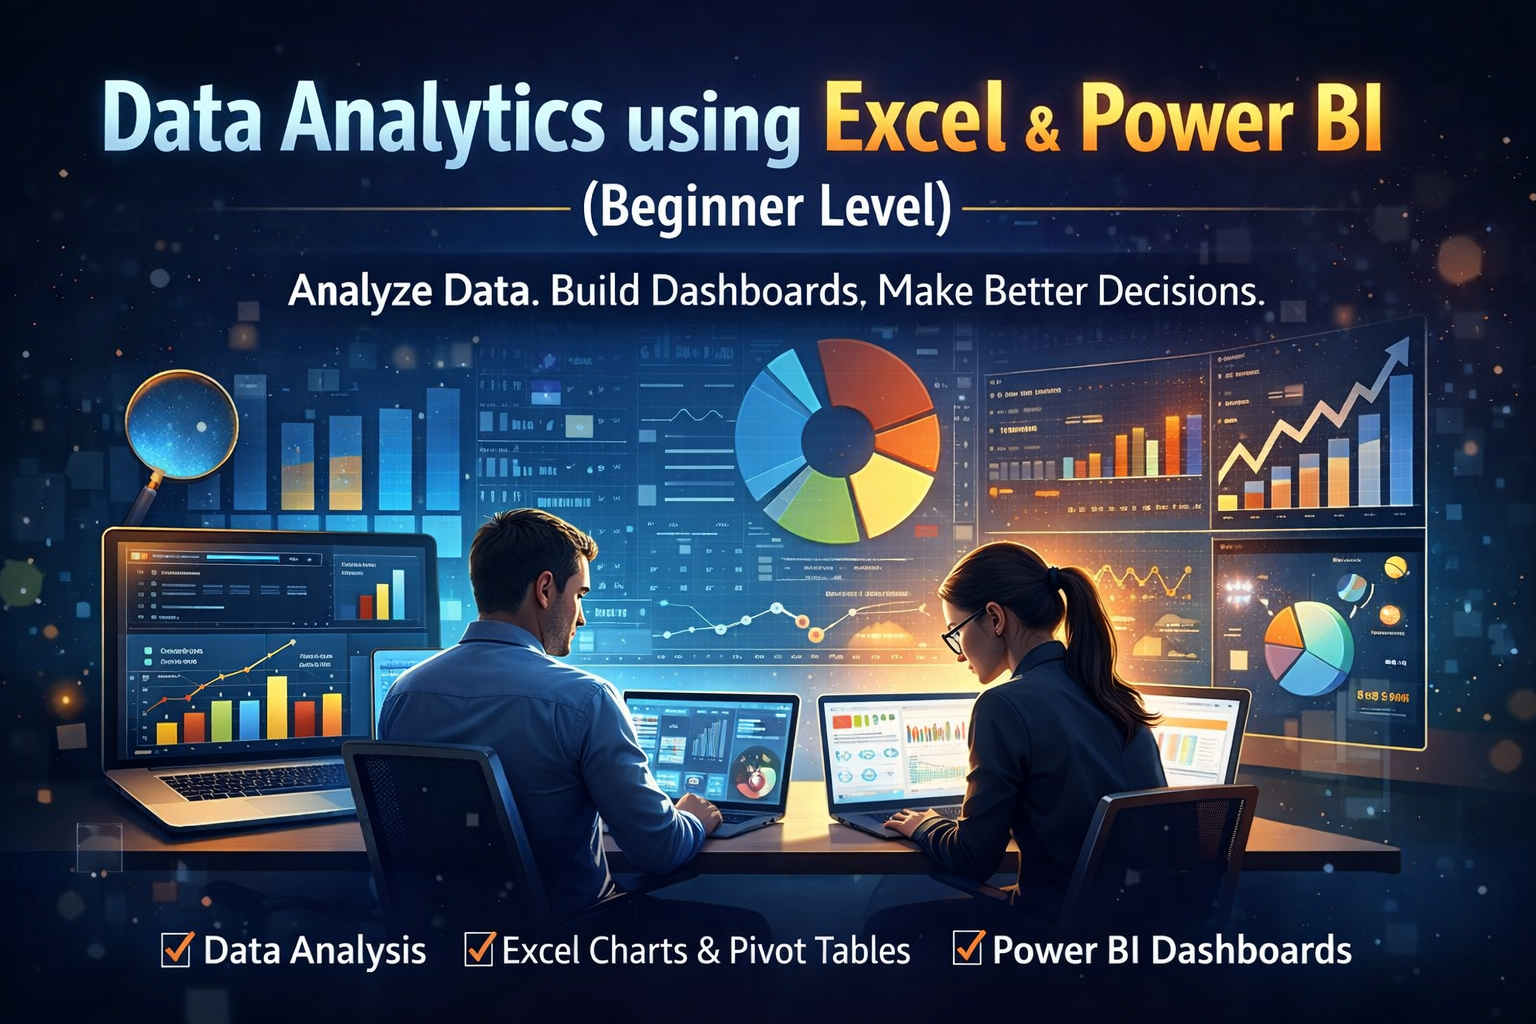
Data Analytics Fundamentals: Excel & Power BI
Learn data analysis using Excel and Power BI. Understand data cleaning, analysis, charts, and dashboards for business decision-making.
Compare & Select from 100+
Best Universities for your Data Analytics Fundamentals: Excel & Power BI
100% Placement Assistance
This course is designed for beginners who want to understand how data is used in real business decisions. It starts with Excel, the most widely used data tool in organizations, and gradually introduces Power BI for basic data visualization and dashboards.
You will learn how to organize raw data, clean it, and convert it into meaningful information. The Excel portion covers essential formulas, functions, pivot tables, charts, and data analysis techniques commonly used in finance, sales, operations, and HR reporting. You will understand why certain data patterns matter and how to present them clearly.
The Power BI section introduces the concept of business intelligence. You will learn how to import data, create basic data models, build simple visuals, and design beginner-level dashboards. The focus is not on advanced technical features but on business understanding and practical usage.
By the end of this course, learners will be able to analyze data independently, create reports, and communicate insights confidently. This course builds a strong foundation for anyone planning a career in analytics or wanting to use data effectively in their current role.