Dashboard & Data Visualization in Excel
This specialization focuses on creating clear, professional dashboards and visual reports in Excel to present data, track performance, and support business decision-making.
Compare & Select from 100+
Best Universities for your Dashboard & Data Visualization in Excel
100% Placement Assistance
Overview
In modern organizations, data alone is not enough. Decision-makers need information presented in a clear, visual, and easy-to-understand manner. Dashboards and visual reports help managers quickly understand performance, trends, and problem areas without going through large tables of numbers. Excel remains one of the most widely used tools for creating dashboards and visual summaries due to its flexibility, availability, and integration with business data.
The Dashboard & Data Visualization in Excel specialization is designed to help working professionals learn how to convert structured data into meaningful visual dashboards using Excel. The focus is not on graphic design or advanced analytics software, but on practical, business-focused visualization techniques that are commonly used in corporate environments.
Learners are trained to think from a management perspective—what information matters, how it should be presented, and how visuals can support faster and better decision-making. This specialization emphasizes clarity, accuracy, and usability over decorative or overly complex visuals.
Table of Contents
- Role of Dashboards in Business
- Understanding Data Visualization in Excel
- Preparing Data for Dashboards
- Choosing the Right Charts for Business Data
- Core Excel Charts Used in Dashboards
- Visualizing Trends and Comparisons
- KPIs and Performance Indicators
- Using Pivot Tables and Pivot Charts
- Interactive Elements in Excel Dashboards
- Dashboard Layout and Design Principles
- Building Single-Page Dashboards
- Department-Wise Dashboard Examples
- Updating and Maintaining Dashboards
- Automating Dashboard Data Refresh
- Avoiding Common Visualization Mistakes
- Data Accuracy and Validation in Dashboards
- Presenting Dashboards to Management
- Collaboration and Dashboard Sharing
- Real-World Dashboard Use Cases
- Career Relevance and Workplace Impact
1. Role of Dashboards in Business
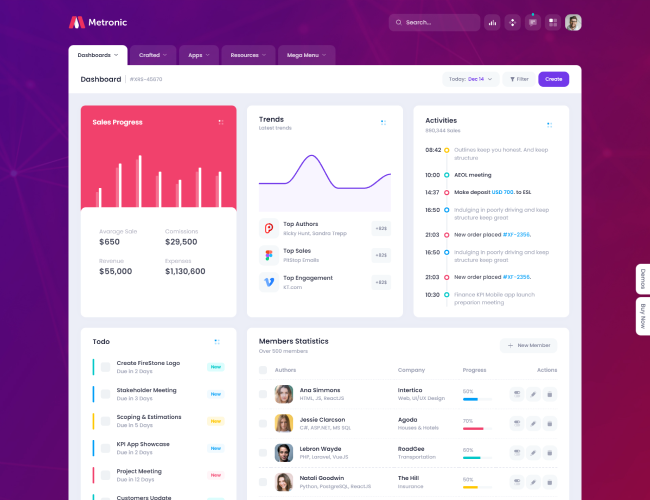
Dashboards act as a summary view of business performance. They allow managers to monitor key metrics, identify trends, and spot issues quickly. This section explains why dashboards are widely used in sales, finance, HR, and operations, and how Excel dashboards support routine reporting.
2. Understanding Data Visualization in Excel
Data visualization is about communicating information visually. Learners understand the difference between raw data and visual insights, and why visual clarity is essential for effective communication in business settings.
3. Preparing Data for Dashboards
Dashboards are only as good as the data behind them. Learners explore how to clean, structure, and organize data before creating visual reports. This includes consistency, completeness, and logical data arrangement.
4. Choosing the Right Charts for Business Data
Not every chart fits every purpose. Learners understand how to select appropriate chart types based on the data and message, such as comparisons, trends, distributions, or proportions.
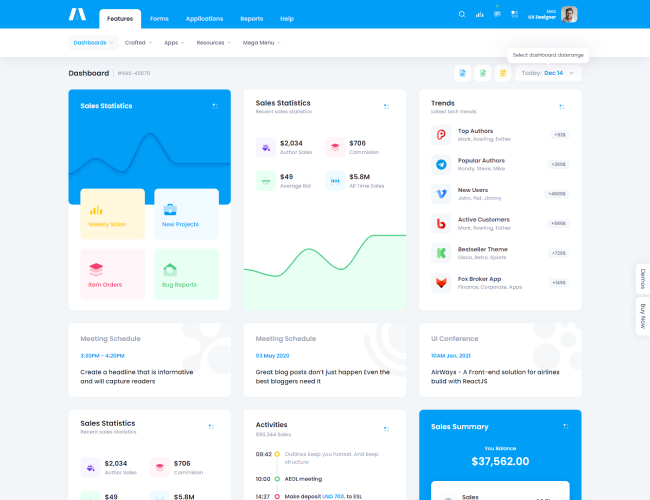
5. Core Excel Charts Used in Dashboards
This section focuses on commonly used Excel charts such as column charts, bar charts, line charts, pie charts, and combination charts. The emphasis is on practical usage rather than advanced customization.
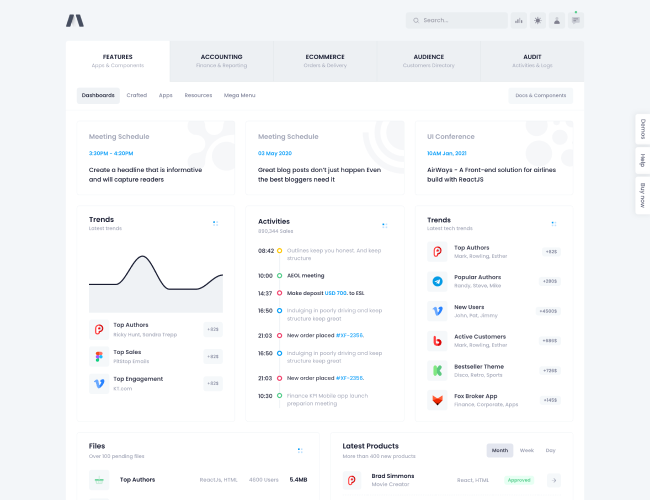
6. Visualizing Trends and Comparisons
Trend analysis and comparisons are common dashboard requirements. Learners explore how Excel visuals highlight growth, decline, seasonality, and performance differences clearly and accurately.
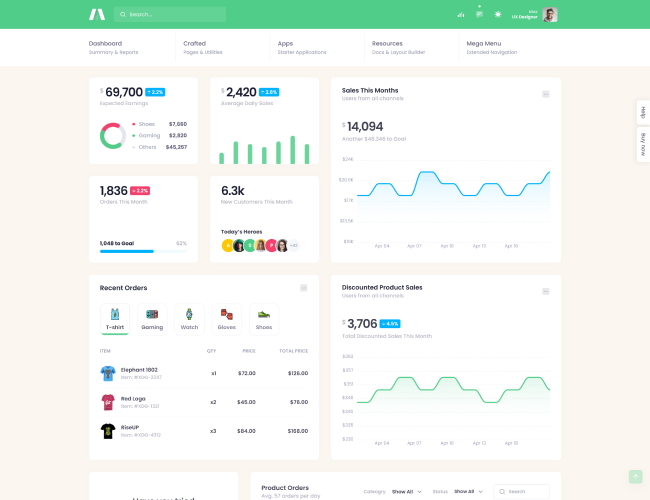
7. KPIs and Performance Indicators
Key Performance Indicators (KPIs) are central to dashboards. Learners understand how KPIs are identified, calculated, and displayed using Excel in a way that supports decision-making.
8. Using Pivot Tables and Pivot Charts
Pivot tables and pivot charts form the backbone of many Excel dashboards. Learners understand how these tools simplify data summarization and make dashboards dynamic and flexible.
9. Interactive Elements in Excel Dashboards
Interactivity improves usability. Learners explore Excel features such as filters, slicers, and drop-downs that allow users to interact with dashboard data without altering the underlying structure.
10. Dashboard Layout and Design Principles
Good dashboards are easy to read and understand. Learners explore layout principles such as spacing, alignment, consistency, and focus. The goal is clarity, not decoration.
11. Building Single-Page Dashboards
Single-page dashboards are commonly used in organizations. Learners understand how to fit key information into one view without clutter, ensuring that dashboards remain readable and effective.
12. Department-Wise Dashboard Examples
Different departments require different dashboards. Learners explore examples of dashboards used in sales, finance, HR, and operations to understand varying requirements and perspectives.
13. Updating and Maintaining Dashboards
Dashboards must be updated regularly. Learners understand how Excel dashboards are maintained, updated with new data, and reviewed to ensure continued accuracy and relevance.
14. Automating Dashboard Data Refresh
Automation reduces manual effort. Learners explore how structured data, formulas, and pivot refresh features help automate dashboard updates while maintaining control and accuracy.
15. Avoiding Common Visualization Mistakes
Poor visualization can mislead users. Learners understand common mistakes such as cluttered dashboards, incorrect chart choices, and misleading visuals, and how to avoid them.
16. Data Accuracy and Validation in Dashboards
Visual reports must reflect accurate data. This section emphasizes validation, cross-checking, and consistency checks before dashboards are shared with stakeholders.
17. Presenting Dashboards to Management
Dashboards are often used in meetings and reviews. Learners understand how to explain dashboard insights clearly and respond to questions from managers and stakeholders.
18. Collaboration and Dashboard Sharing
Dashboards are frequently shared across teams. Learners explore best practices for sharing Excel dashboards, managing versions, and maintaining consistency across users.
19. Real-World Dashboard Use Cases
Practical scenarios help learners connect dashboard concepts to real workplace requirements. These use cases reinforce how dashboards support business monitoring and reporting.
20. Career Relevance and Workplace Impact
Dashboard and visualization skills improve a professional’s ability to communicate data-driven insights. While Excel dashboards do not replace BI tools, they remain highly valuable in roles involving reporting, coordination, analysis, and management support.
Expected Learning Outcomes
After completing this specialization, learners are expected to:
- Create clear and professional Excel dashboards
- Visualize business data accurately
- Present insights effectively to management
- Maintain and update dashboards responsibly