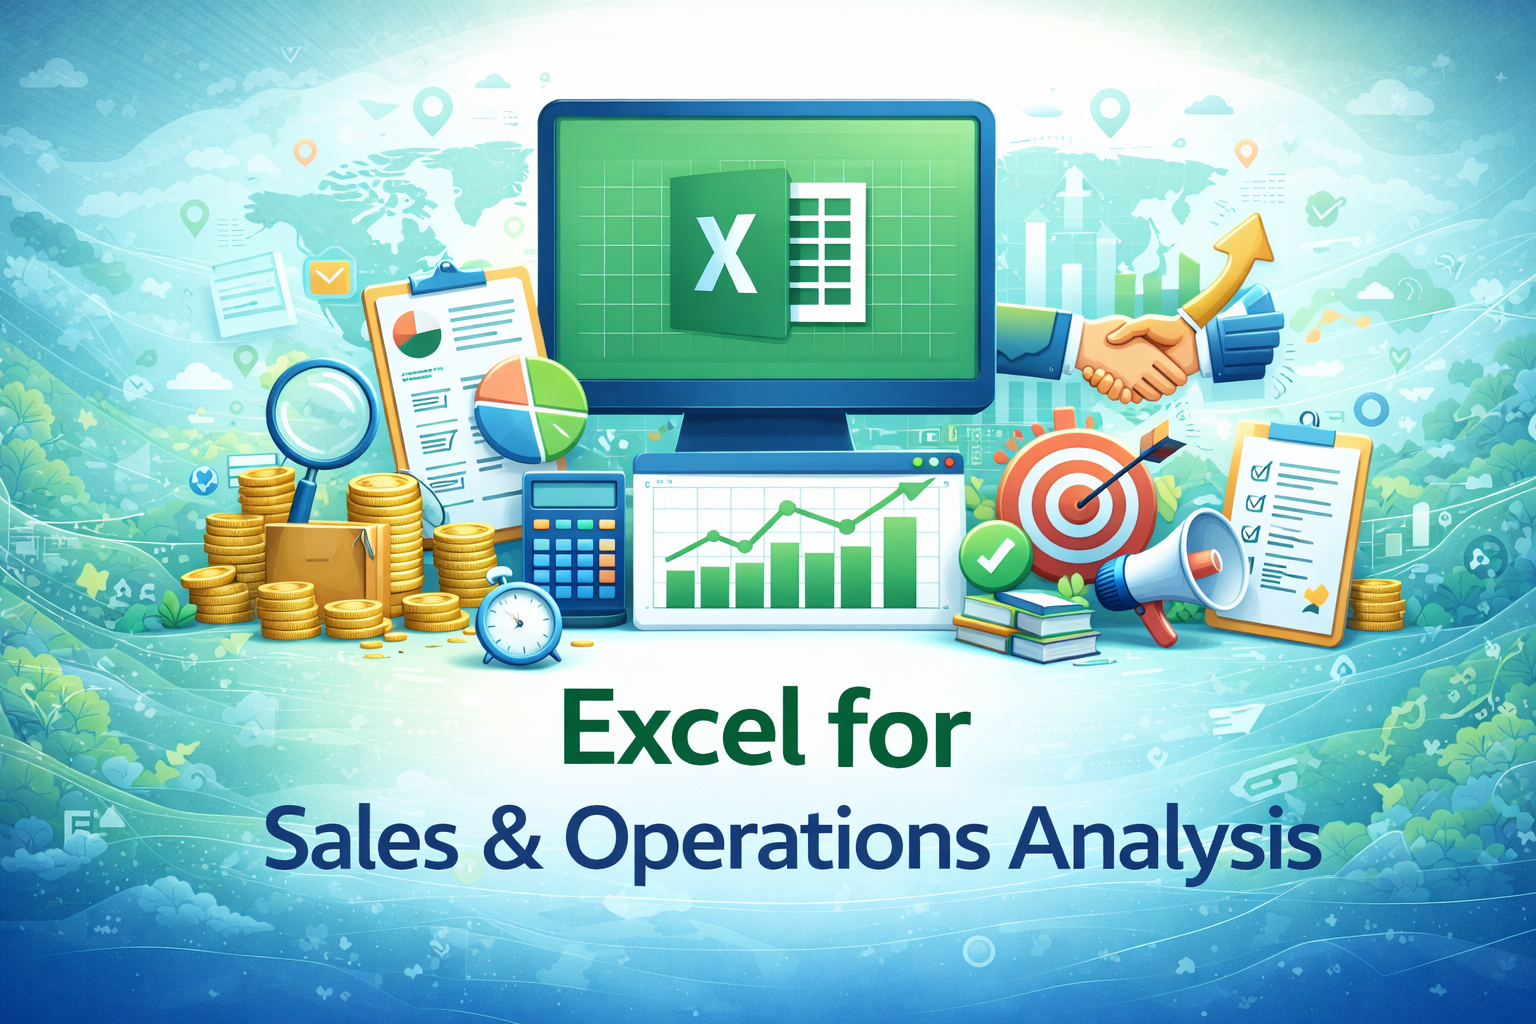
Excel for Sales & Operations Analysis
This specialization focuses on using Excel to analyze sales performance, operational data, targets, trends, and efficiency metrics commonly used by sales teams, operations managers, and business analysts.
Compare & Select from 100+
Best Universities for your Excel for Sales & Operations Analysis
100% Placement Assistance
Overview
Sales and operations teams generate large volumes of data on a daily basis. Sales transactions, customer records, targets, dispatch details, inventory movement, and performance metrics must be tracked, analyzed, and reported regularly to support business decisions. While advanced analytics tools exist, Excel continues to be one of the most widely used tools for sales and operations analysis due to its flexibility, accessibility, and ease of use.
The Excel for Sales & Operations Analysis specialization is designed to help working professionals understand how Excel is practically used to analyze sales and operational data in real organizational environments. The focus is on transforming raw data into meaningful insights that help teams track performance, identify gaps, and improve efficiency.
This specialization does not aim to teach advanced data science or statistical modeling. Instead, it focuses on applied Excel analysis skills that are commonly expected in sales coordination, operations management, business support, and reporting roles.
Learners are trained to work with structured data, apply logical analysis, summarize performance, and present insights clearly to managers and stakeholders.
Table of Contents
- Role of Excel in Sales & Operations
- Understanding Sales and Operational Data
- Structuring Sales and Operations Data in Excel
- Sales Performance Tracking
- Target vs Achievement Analysis
- Customer and Product-Level Analysis
- Time-Based Sales Analysis
- Operational Metrics and Efficiency Tracking
- Inventory and Dispatch Data Analysis
- Using Pivot Tables for Sales & Operations
- Charts and Visual Analysis for Performance
- Dashboard Basics for Sales & Operations
- Exception and Variance Analysis
- Automating Sales and Operations Reports
- Data Validation and Accuracy Checks
- Professional Reporting for Management
- Collaboration Across Sales and Operations Teams
- Common Analysis Mistakes and How to Avoid Them
- Practical Sales & Operations Use Cases
- Career Relevance and Workplace Impact
1. Role of Excel in Sales & Operations
Excel plays a critical role in sales and operations because it allows teams to quickly analyze performance data without depending entirely on specialized software. Sales executives, operations managers, coordinators, and analysts frequently use Excel to prepare reports, track targets, and monitor efficiency.
This section helps learners understand how Excel supports day-to-day sales and operational decision-making.
2. Understanding Sales and Operational Data
Sales and operations data includes transaction records, customer details, product information, quantities, pricing, dates, and locations. Learners understand the importance of data accuracy and consistency, as incorrect data can lead to misleading analysis and poor decisions.
The section builds awareness of data responsibility before analysis begins.
3. Structuring Sales and Operations Data in Excel
Well-structured data is essential for effective analysis. Learners explore how sales and operational data should be arranged in rows and columns, with consistent formats and clear headers.
Proper structuring makes analysis faster, more accurate, and easier to update.
4. Sales Performance Tracking
Tracking sales performance is a core activity in most organizations. Learners understand how Excel is used to track sales volume, revenue, and performance across individuals, teams, or regions.
The focus is on summarizing data clearly rather than complex forecasting.
5. Target vs Achievement Analysis
Organizations often set sales and operational targets. Learners explore how Excel is used to compare targets against actual performance and identify gaps.
This section introduces basic performance evaluation using Excel formulas and summaries.
6. Customer and Product-Level Analysis
Sales data is often analyzed by customer or product. Learners understand how Excel supports customer-wise and product-wise analysis to identify top performers, low performers, and trends.
This analysis helps organizations focus on priorities.
7. Time-Based Sales Analysis
Time-based analysis is important for understanding growth and seasonality. Learners explore how Excel is used to analyze data by day, month, quarter, or year.
The goal is to identify patterns rather than predict future outcomes.
8. Operational Metrics and Efficiency Tracking
Operations teams track efficiency metrics such as turnaround time, output volume, delays, and utilization. Learners understand how Excel supports tracking and summarizing such operational data.
This section connects Excel analysis with operational improvement.
9. Inventory and Dispatch Data Analysis
Excel is commonly used to track inventory levels and dispatch details. Learners explore how Excel supports monitoring stock movement, order fulfillment, and basic inventory summaries.
This section emphasizes clarity and consistency in data handling.
10. Using Pivot Tables for Sales & Operations
Pivot tables are essential for summarizing large datasets. Learners understand how pivot tables are used to generate quick sales and operations summaries without manual calculations.
The focus is on practical use cases rather than advanced pivot techniques.
11. Charts and Visual Analysis for Performance
Visual representation helps management understand data quickly. Learners explore how Excel charts are used to present sales trends, comparisons, and performance summaries.
The emphasis is on clarity and correct interpretation.
12. Dashboard Basics for Sales & Operations
Dashboards provide a consolidated view of key metrics. Learners are introduced to basic dashboard concepts and understand how Excel dashboards are used to track sales and operations performance.
Design simplicity and usefulness are emphasized.
13. Exception and Variance Analysis
Exception analysis helps identify issues such as underperformance, delays, or unusual variations. Learners understand how Excel highlights exceptions and variances that require attention.
This supports proactive decision-making.
14. Automating Sales and Operations Reports
Automation helps reduce repetitive reporting tasks. Learners explore how formulas, pivot tables, and templates automate sales and operations reports while maintaining transparency.
Automation is positioned as a productivity tool, not a replacement for judgment.
15. Data Validation and Accuracy Checks
Accurate analysis depends on correct data. Learners understand how Excel features are used to validate data entries, reduce errors, and verify calculations before reporting.
This builds trust in analysis outputs.
16. Professional Reporting for Management
Reports prepared for management must be clear, concise, and focused. Learners understand how to present sales and operations insights in a structured and professional manner.
The focus is on decision support, not decoration.
17. Collaboration Across Sales and Operations Teams
Sales and operations teams often share data and reports. Learners explore how Excel files are shared, reviewed, and updated responsibly across teams.
This section emphasizes coordination and communication.
18. Common Analysis Mistakes and How to Avoid Them
Learners are introduced to common mistakes such as misinterpretation of data, poor structure, overcomplicated reports, and incorrect summaries. Understanding these pitfalls helps improve analysis quality.
19. Practical Sales & Operations Use Cases
Realistic workplace scenarios help learners connect Excel analysis skills to actual sales and operations tasks. These examples reinforce practical understanding rather than theoretical knowledge.
20. Career Relevance and Workplace Impact
Strong Excel analysis skills improve effectiveness in sales and operations roles. Professionals who can analyze performance data and present insights clearly are often trusted with greater responsibility.
Excel remains a valuable supporting skill for roles in sales coordination, operations management, reporting, and business support.
Expected Learning Outcomes
After completing this specialization, learners are expected to:
- Analyze sales and operations data using Excel
- Track targets, performance, and efficiency metrics
- Prepare clear and structured analysis reports
- Support decision-making with accurate data summaries