Excel for MIS & Management Reporting
This specialization trains professionals to create accurate, structured, and decision-ready MIS reports and management dashboards using Excel, focusing on real organizational reporting needs.
Compare & Select from 100+
Best Universities for your Excel for MIS & Management Reporting
100% Placement Assistance
Overview
Management Information System (MIS) reporting is a critical function in modern organizations. Almost every department HR, finance, sales, operations, marketing, and administration relies on structured reports to track performance, monitor trends, and support managerial decisions.
Excel remains the primary MIS reporting tool in most Indian and global organizations, especially for small to mid-sized companies. While advanced BI tools exist, Excel continues to dominate due to its flexibility, accessibility, and familiarity.
The Excel for MIS & Management Reporting specialization is designed to help learners develop end-to-end MIS reporting skills, starting from raw data handling to professional summary reports and dashboards that management can easily understand.
This specialization does not focus on theory-heavy analytics or data science concepts. Instead, it focuses on practical Excel reporting skills that professionals are expected to perform in real office environments—daily, weekly, monthly, and quarterly.
Learners are trained to think like MIS professionals:
- What data matters
- How to summarize it
- How to present it clearly
- How to make reports decision-friendly
Table of Contents
- Introduction to MIS & Management Reporting
- Role of Excel in Organizational Reporting
- Understanding Business Data for MIS
- Types of MIS Reports Used in Organizations
- Structuring Raw Data for Reporting
- Data Cleaning and Validation for MIS
- Using Excel Tables for Reporting
- Pivot Tables for Summary Reports
- Advanced Pivot Table Techniques
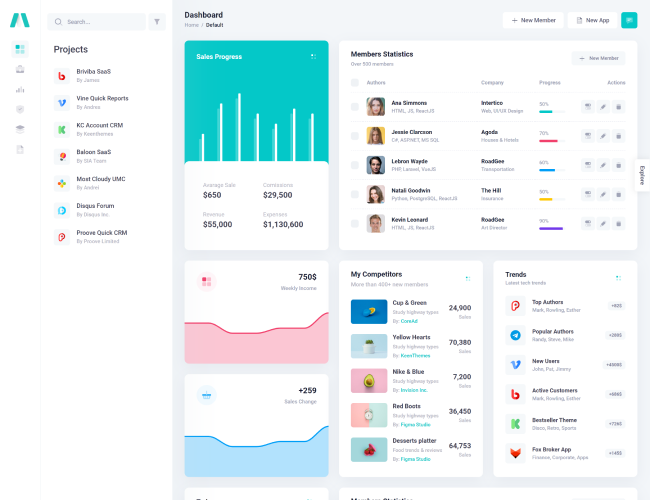
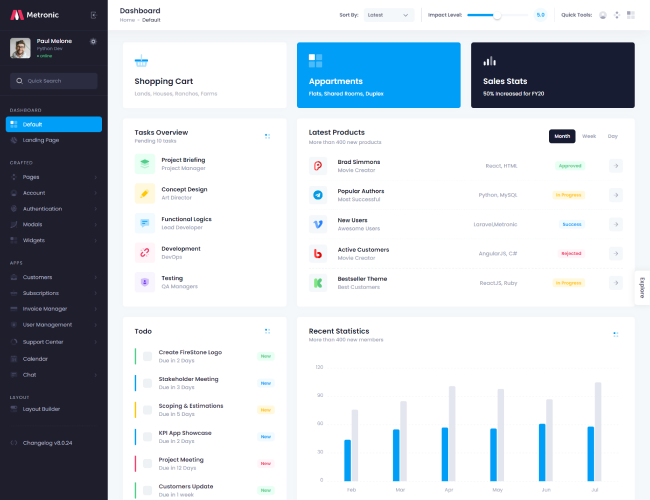
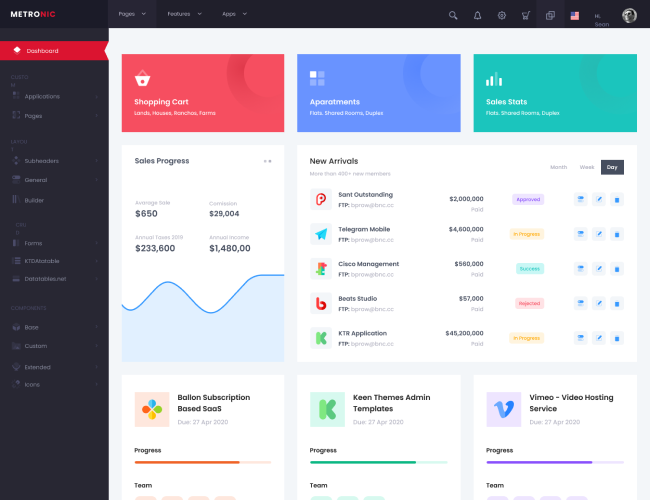
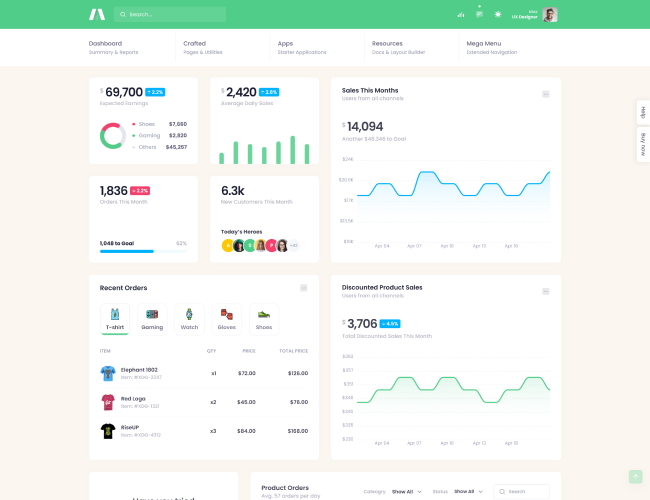
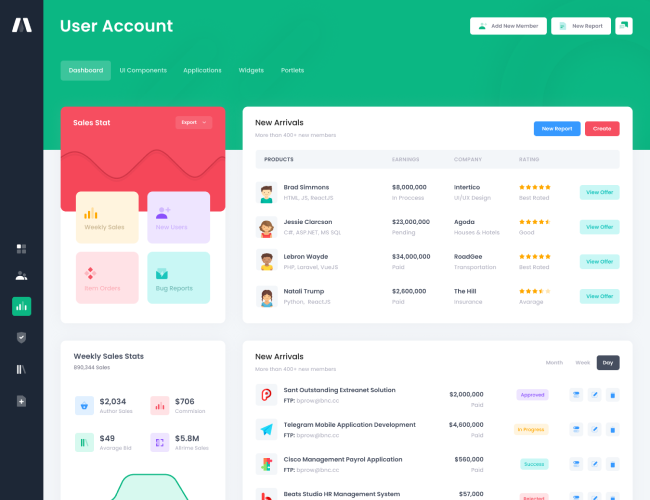
- Creating MIS Charts and Visual Summaries
- Dashboard Design Principles in Excel
- Building Interactive Excel Dashboards
- Monthly, Weekly, and Daily MIS Reports
- Department-Wise MIS Reporting
- Performance Tracking and KPI Reporting
- Automating MIS Reports in Excel
- Error Checking and Report Accuracy
- Presenting MIS Reports to Management
- Common MIS Reporting Mistakes and How to Avoid Them
- Career Relevance and Workplace Impact
1. Introduction to MIS & Management Reporting
MIS reporting refers to the process of collecting, processing, and presenting business data in a structured format to support management decision-making.
MIS reports are used to:
- Monitor performance
- Track targets and outcomes
- Identify issues and trends
- Support planning and forecasting
This section introduces learners to the purpose and importance of MIS reporting and explains why Excel is still the most widely used tool for this function.
2. Role of Excel in Organizational Reporting
Despite the availability of specialized software, Excel remains central to reporting because:
- It is widely available
- It allows customization
- It supports quick changes
- It integrates easily with other systems
Learners understand why organizations rely on Excel and what expectations managers have from Excel-based MIS reports.
3. Understanding Business Data for MIS
Not all data is useful for MIS reporting.
This module helps learners understand:
- Operational data vs summary data
- Transactional data vs reporting data
- Importance of data relevance
Learners are trained to identify what data should be included in reports and what should be excluded.
4. Types of MIS Reports Used in Organizations
Different reports serve different purposes.
This section explains common MIS report types such as:
- Operational reports
- Performance reports
- Exception reports
- Summary reports
Learners understand when and why each report type is used.
5. Structuring Raw Data for Reporting
Raw data often comes in unorganized formats.
This module covers:
- Converting raw data into structured formats
- Column naming standards
- Avoiding merged cells and inconsistent layouts
Learners learn how proper data structure improves reporting accuracy and efficiency.
6. Data Cleaning and Validation for MIS
Accurate reports depend on clean data.
Topics include:
- Identifying duplicates
- Handling missing values
- Correcting data inconsistencies
- Validating entries before reporting
This section emphasizes data responsibility, which is critical in MIS roles.
7. Using Excel Tables for Reporting
Excel Tables make reporting easier and more reliable.
Learners explore:
- Creating tables from raw data
- Benefits of structured references
- Automatic updates in reports
This module shows how tables reduce manual work and errors.
8. Pivot Tables for Summary Reports
Pivot Tables are the backbone of MIS reporting.
This section covers:
- Creating pivot tables
- Understanding rows, columns, values, and filters
- Summarizing large datasets quickly
Realistic reporting examples help learners grasp pivot logic.
9. Advanced Pivot Table Techniques
Building on basics, learners explore:
- Grouping data
- Calculated fields
- Custom summaries
- Multiple pivot tables from one dataset
This enables more flexible and meaningful MIS reports.
10. Creating MIS Charts and Visual Summaries
Management often prefers visuals over raw numbers.
This module covers:
- Choosing the right chart type
- Creating clean and readable charts
- Avoiding misleading visuals
Learners learn to convert data into clear visual insights.
11. Dashboard Design Principles in Excel
Dashboards present key metrics at a glance.
Learners understand:
- What makes a good dashboard
- Layout and spacing principles
- Focus on clarity, not decoration
This section introduces dashboard thinking before actual creation.
12. Building Interactive Excel Dashboards
This module focuses on:
- Using pivot charts
- Slicers and filters
- Dynamic data views
Learners build dashboards that allow management to explore data easily.
13. Monthly, Weekly, and Daily MIS Reports
Different reporting frequencies require different approaches.
Learners understand:
- Daily operational reports
- Weekly performance tracking
- Monthly management summaries
Examples show how structure changes based on reporting frequency.
14. Department-Wise MIS Reporting
MIS reporting varies across departments.
This section covers reporting examples for:
- Sales
- HR
- Finance
- Operations
Learners see how Excel adapts to different departmental needs.
15. Performance Tracking and KPI Reporting
Key Performance Indicators (KPIs) are central to MIS.
Learners explore:
- Understanding KPIs
- Tracking targets vs actuals
- Highlighting performance gaps
This builds analytical thinking within Excel reporting.
16. Automating MIS Reports in Excel
Manual reporting is time-consuming.
This module introduces:
- Formula-driven reports
- Pivot refresh automation
- Template-based reporting
Automation reduces effort and improves consistency.
17. Error Checking and Report Accuracy
Errors in MIS reports can mislead management.
Learners learn:
- Cross-verification techniques
- Error identification
- Accuracy checks before submission
This section builds professional accountability.
18. Presenting MIS Reports to Management
Presentation matters as much as data.
Learners understand:
- How to structure reports
- How to explain numbers clearly
- How to answer management queries
This improves confidence in professional interactions.
19. Common MIS Reporting Mistakes and How to Avoid Them
This section highlights:
- Overloading reports with data
- Poor formatting
- Incorrect summaries
- Misleading visuals
Learners learn how to avoid mistakes commonly seen in offices.
20. Career Relevance and Workplace Impact
This specialization helps learners:
- Perform MIS reporting independently
- Support managers with reliable data
- Improve visibility and responsibility at work
MIS and reporting skills are highly valued across roles, especially in administrative, analytical, and managerial positions.
Outcome Summary (Realistic & Verifiable)
After completing this specialization, learners are expected to:
- Create structured MIS reports in Excel
- Use pivot tables and dashboards confidently
- Present data clearly to management
- Improve reporting accuracy and efficiency